• Comparison of Results:

    Central Tendency:
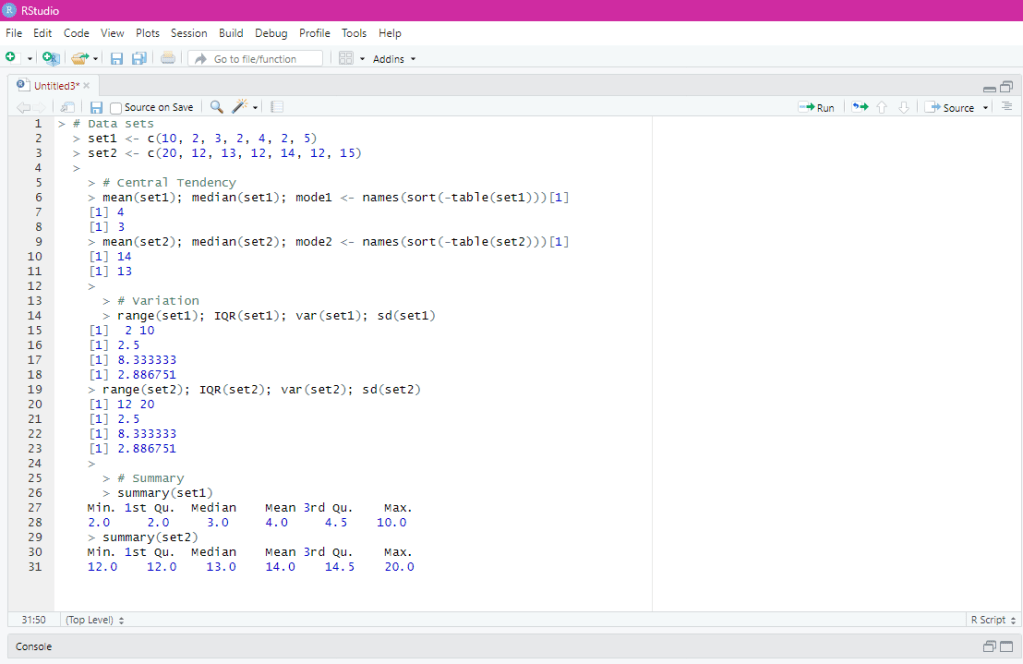
    Set #1 is centered around smaller values: mean = 4, median = 3, mode = 2, while Set #2 is centered around larger values: mean = 14, median = 13, mode = 12. This shows that Set #2 is a shifted version of Set #1, with all values about 10 units higher.

    Variation:
    Both sets have the same spread. Their range, interquartile range, variance, and standard deviation are the same. This means the distribution shape is the same, but Set #2 is shifted upward.

    Interpretation:
    Set #1 represents a lower scale dataset: values mostly between 2–5, with one outlier at 10. Set #2 follows the same pattern but is shifted upward: values between 12–15, with one outlier at 20. Both sets are equally consistent in terms of variation, but they differ in their overall level.

  • RStudio Results:

    Using the given dataset (I included the 19 that was in the instructions, but was not in the vector listed), I created the vector “assignment2.”

    Since this vector is numeric, I can use mathematical functions in R.

    I created the function “myMean” using the given instructions: myMean -> function(assignment2) {return(sum(assignment2)/length(assignment2))}

    -> sum(assignment2) adds up all the values in the vector.

    -> length(assignment2) counts the amount of values in the vector.

    -> the “/” divides the values.

    Using the given vector and the function “myMean” I found the mean of the vector to be 18.7. To conclude, the vector stores a dataset of numbers, and the function I created calculated the mean of that dataset. This assignment helped me get a introduction to understand vectors and creating functions in R.

  • Welcome to WordPress! This is your first post. Edit or delete it to take the first step in your blogging journey.

  • I also appreciate Professor’s incorporation of blogs into this class. Having a public forum to discuss and view other classmate’s work is exciting, and not something I have seen incorporated before, aside from discussion boards.

    I found the lecture to be a great refresher on the basics of statistics and analysis, and I am excited to get going with this course.

Design a site like this with WordPress.com
Get started