1.
2.
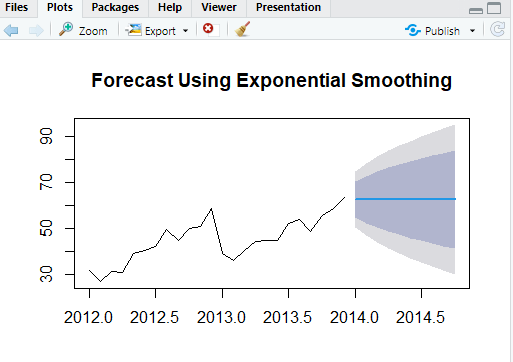
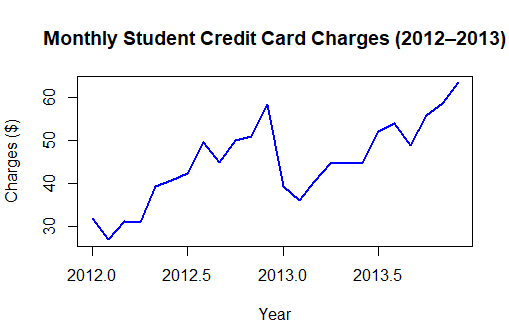
3. The time-series plot makes it clear that student credit card charges steadily increased across 2012 and 2013. Even though there are a few small dips month to month, the overall pattern trends upward, especially toward the end of each year. There isn’t a strong seasonal pattern or any big recurring spikes, but the data consistently moves higher over time, suggesting a gradual rise in spending.
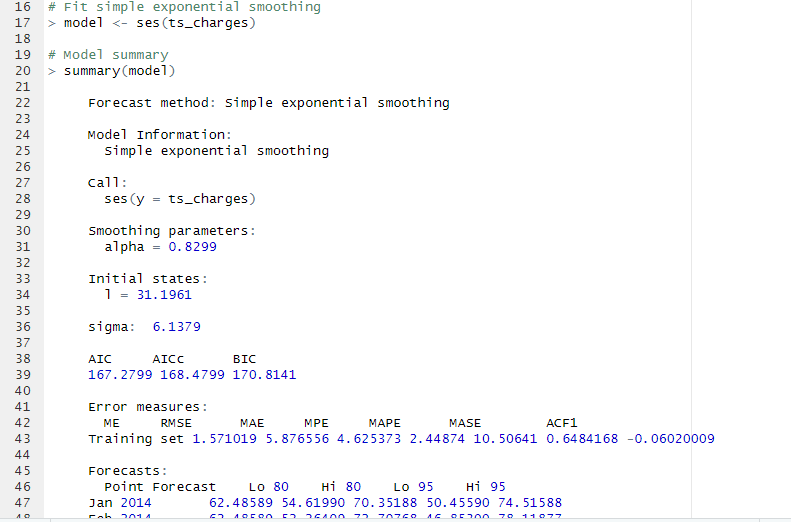
The exponential smoothing model captures that same upward movement and places more weight on the most recent months, which makes sense given how consistently the values increase. The forecast extends this trend into 2014, showing charges continuing to rise with a relatively narrow confidence band at first and wider intervals further out. In simple terms, the model is confident that spending will keep increasing, even if the exact values become harder to pinpoint over time. Overall, the smoothing approach fits this dataset well because the pattern is steady and doesn’t have major irregular jumps or seasonal swings.

Leave a comment