12.1: R Results
12.3: R Results:
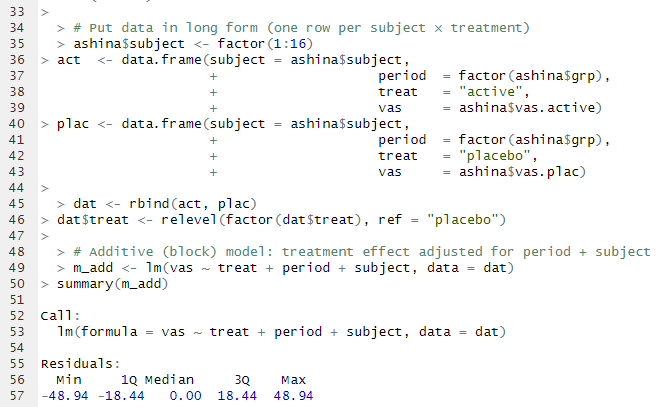
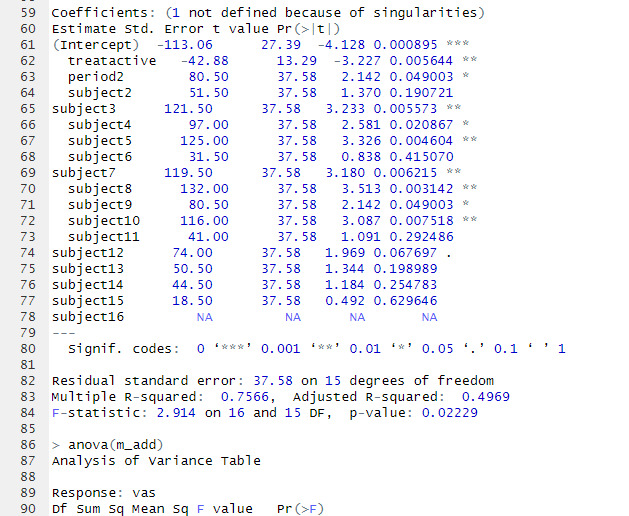
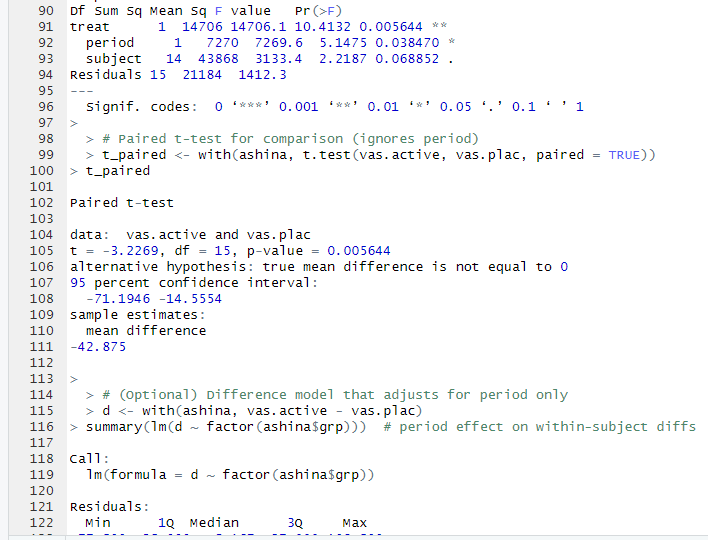
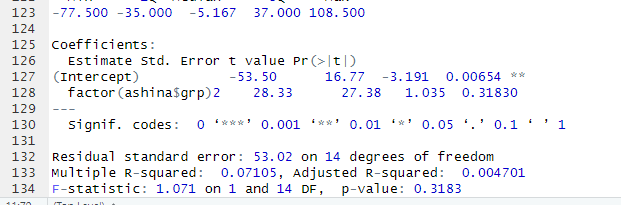
12.1 Comparison of Additive Model and Paired t-Test Results: Both the additive model and paired t-test show a significant treatment effect. In the additive model, the active treatment lowered VAS scores by about –42.9 (p = 0.0056) after adjusting for period and subject. The period effect was also marginally significant (p = 0.038). The paired t-test produced nearly identical results (mean difference = –42.9, t(15) = –3.23, p = 0.0056). Overall, both methods agree that the active treatment significantly reduces pain, and the adjustment for period and subject does not change this conclusion.
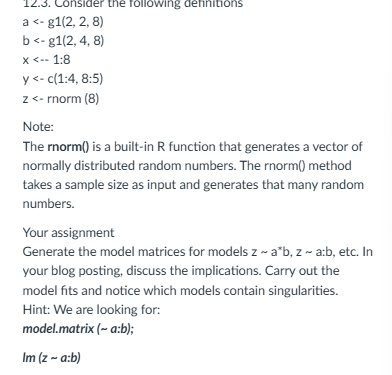
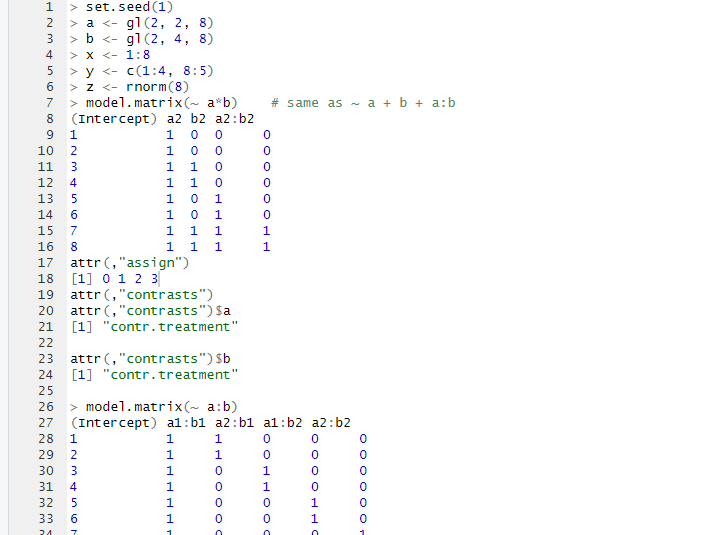
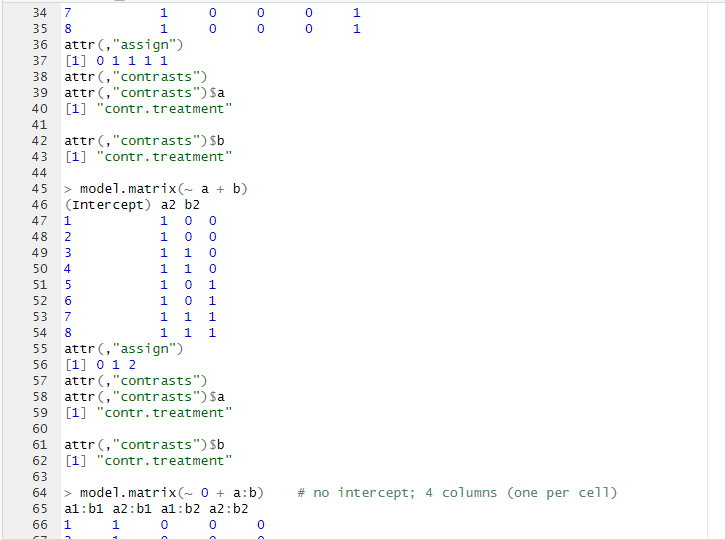
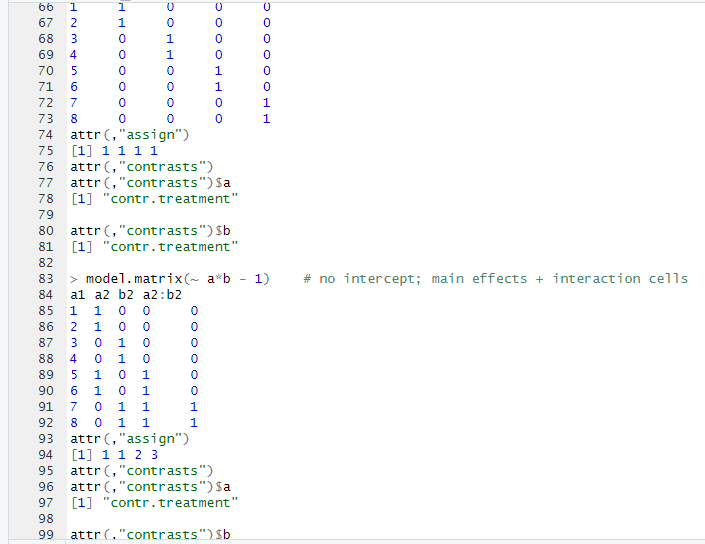
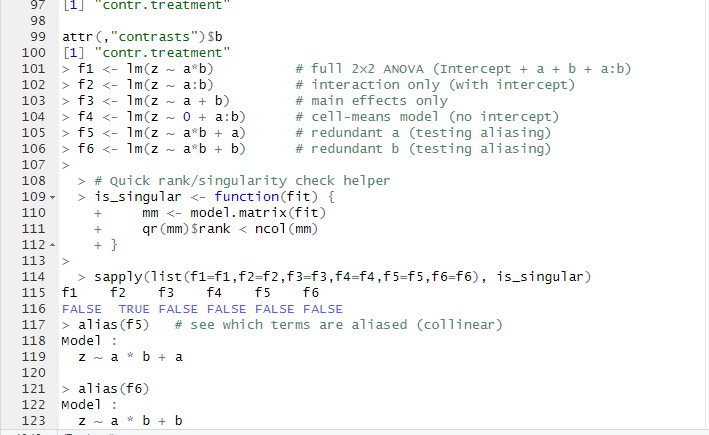
12.3: Model Matrices and Singularities: The generated model matrices illustrate how including or excluding interactions and intercepts affects the model structure.
- z ~ a*b creates a full two-way ANOVA design (main effects for a, b, and their interaction).
- z ~ a:b includes only the interaction terms; this model was singular, showing that without main effects, the interaction terms alone do not provide independent information.
- z ~ a + b represents only the main effects and was not singular.
- z ~ 0 + a:b (no intercept) produced four cell means, one for each factor combination, and was full rank.
- Adding redundant terms (z ~ a*b + a or z ~ a*b + b) did not introduce singularities because R automatically detects and drops aliased columns.Overall, the results show that singularities occur when model terms are linearly dependent (as in z ~ a:b), and R’s
lm()function handles redundancy by excluding overlapping predictors.

Leave a comment