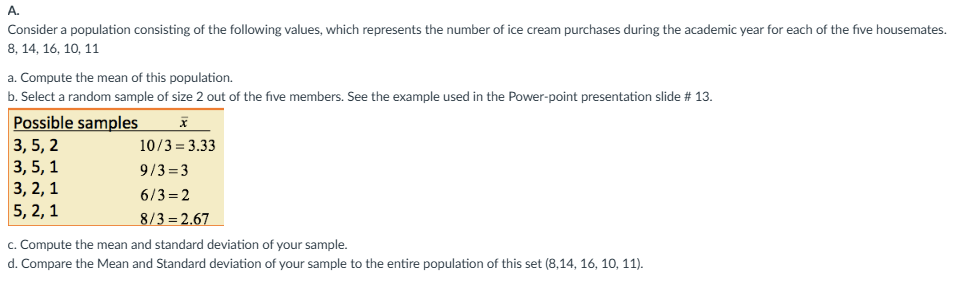
A. Population Mean = (8+14+16+10+11)/(5) = 59/5 = 11.8
B. Taking a random sample of 2 from 5 members: There are 10 possible members.
Sample 1 Values: 8, 14 Sample Mean: 11
Sample 2 Values: 8, 16 Sample Mean: 12
Sample 3 Values: 8, 10 Sample Mean: 9
Sample 4 Values: 8, 11 Sample Mean: 9.5
Sample 5 Values: 14, 16 Sample Mean: 15
Sample 6 Values: 14, 10 Sample Mean: 12
Sample 7 Values: 14, 11 Sample Mean: 12.5
Sample 8 Values: 16, 10 Sample Mean: 13
Sample 9 Values: 16, 11 Sample Mean: 13.5
Sample 10 Values: 10, 11 Sample Mean: 10.5
C. Mean of sample means = (11+12+9+9.5+15+12+12.5+13+13.5+10.5)/(10) = 118/10 = 11.8
Standard Deviation = (sqrt(14.44+4.84+17.64+3.24+.64)/(5)) = sqrt(8.16) = 2.86
D. Mean of the sample distribution = 11.8 (Matches the population mean)
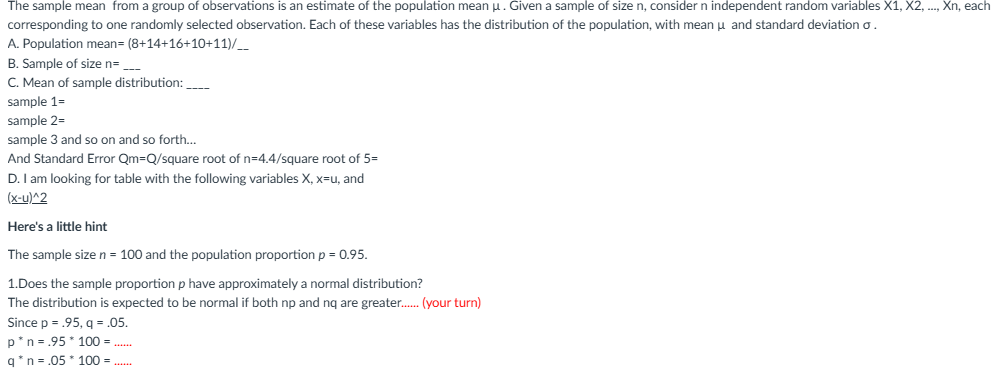
X x = u (x – u)^2
8 11.8 14.44
14 11.8 4.84
16 11.8 17.64
10 11.8 3.24
11 11.8 0.64
n = 100 p = .95 (q = .05)
- Yes, np = 95 and nq = 5 , so the sample proportion has an approximately normal distribution.
- The smallest n for normality with p = .95 . nq = n(.05) greater than or equal to 5 so n greater than or equal to 100. Smallest n = 100
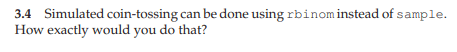
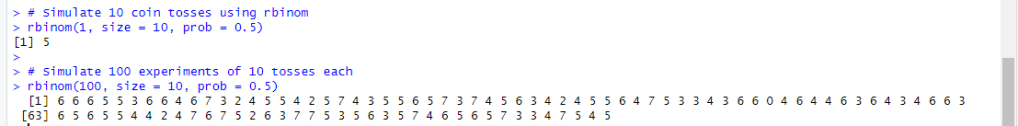
rbinom draws from the binomial distribution directly, whereas sample emulates every flip one by one. For this reason, it is more statistically accurate to use rbinom.

Leave a comment