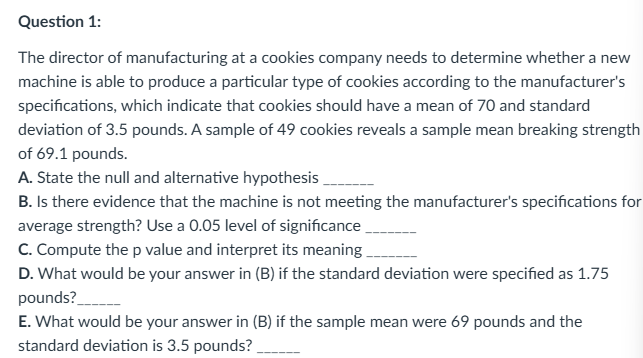
A) Null hypothesis: 70 Alternative hypothesis: 70
B-C)Test statistic: z=xˉ−μ0/σ/sqrt(n)=69.1−70/3.5/sqrt(49)=−1.8
Two-tailed p-value: p=2Φ(−∣z∣) ≈ 0.0719
Interpretation: There isn’t sufficient evidence that the mean breaking strength differs from 70; with these data we can’t conclude the machine is off spec.
Decision (α = .05): p ≈ 0.0719 > .05 → Fail to reject H₀.
D) z = 69.1-70/1.75/sqrt(49) = -3.6
Two-tailed p ≈ 0.00032
Decision: p < .05 → Reject H₀. Evidence the machine is not meeting spec
E) z = 69-70/3.5/sqrt(49)
Two-tailed p ≈ 0.0455
Decision: p < .05 → Reject H₀. Evidence the machine is not meeting spec.
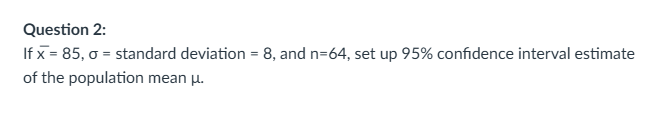
Given x̄ = 85, σ = 8, n = 64
SE = 8/√64 = 1
z* = 1.96
95% CI: 85±1.96(1) -> (83.04, 86.96)

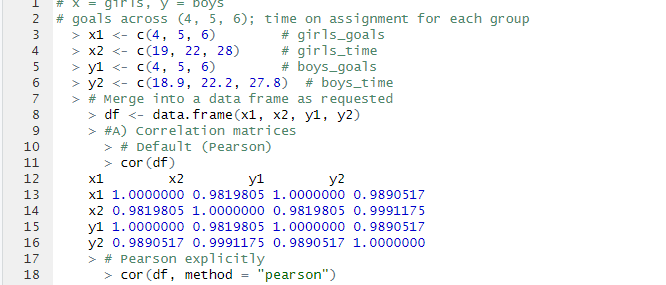
Girls: goals = (4,5,6), time = (19,22,28)
Boys: goals = (4,5,6), time = (18.9,22.2,27.8)
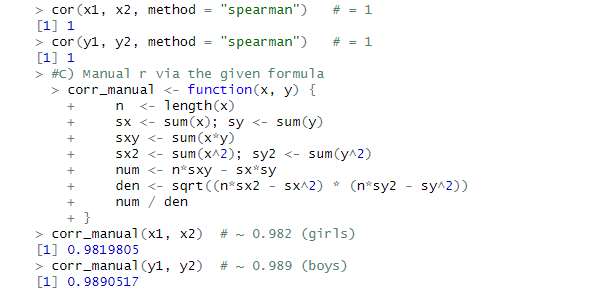
A) Correlation coefficients:
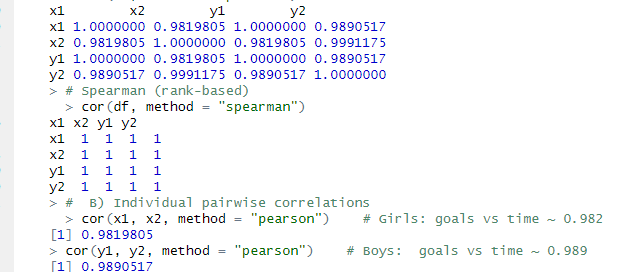
Girls: r ≈ 0.982
Boys: r ≈ 0.989
B) Pearson & Spearman:
Pearson (linear relationship): ≈ 0.98–0.99.
Spearman (rank-based monotonic): ρ = 1.0, showing perfect monotonic increase.
C) Interpretation:
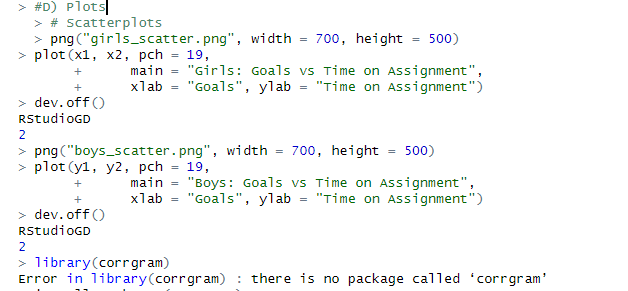
Both girls and boys show a very strong positive correlation between goals and time spent. As goals increase, time on assignment also increases consistently.

Leave a comment